
Why the PSL Is so Hard to Call
During the 2016/17 to 2025/26 seasons, an average of 2.09 goals were scored per match in the South African Premiership, compared with 2.62 to 3.10 in the five major European leagues. Only 34.4 per cent of PSL matches ended with more than 2.5 goals, compared to 48–60 per cent in Europe. Meanwhile, 13.2 per cent of PSL matches ended 0–0, compared to 5–7 per cent in Europe.
These figures are based on an analysis by Jabula Bets of 2,379 South African Premiership matches across 10 seasons. The analysis used results from worldfootball.net and European records from football-data.co.uk. They provide supporters with a basis for evaluating a fixture, showing that there are fewer goals and more drawn matches than in European competitions.

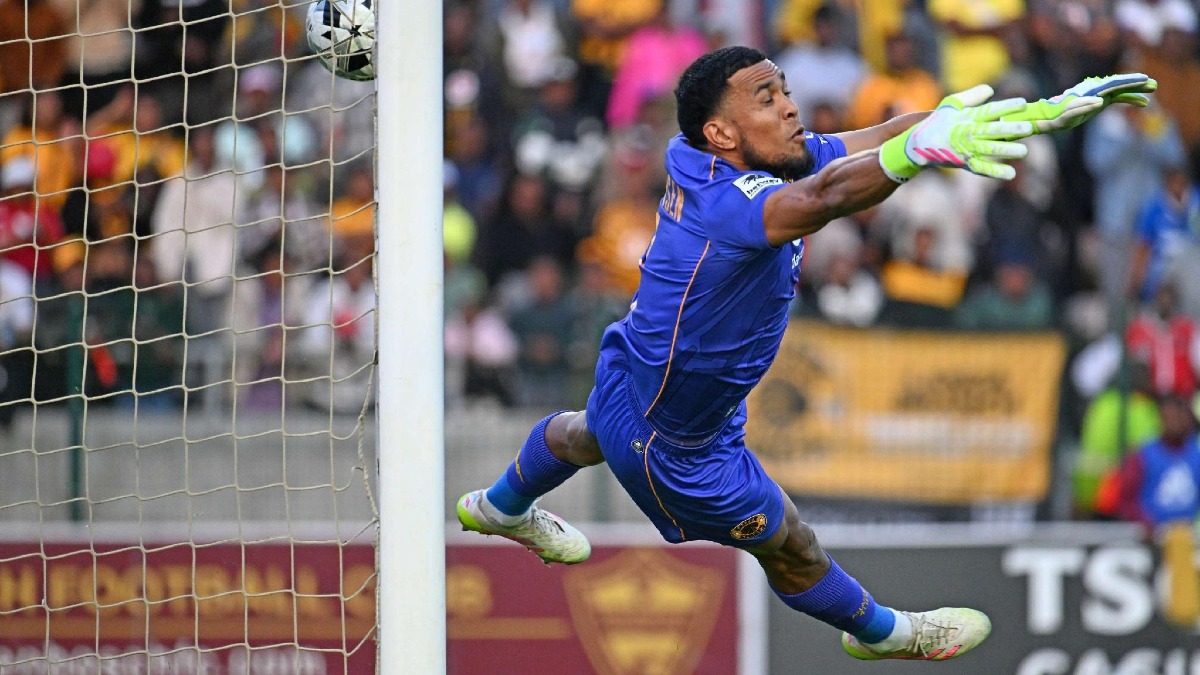
Goals were less frequent in the PSL than in Europe’s big five across the period studied. (source: Goal.com)
The PSL against Europe's big five, 2016/17 to 2025/26
Source: Analysis of PSL results from WorldFootball.net and European records from Football-Data.co.uk for the period 2016/17–2025/26.
The Bundesliga had both the highest average number of goals and the highest proportion of matches with more than 2.5 goals. La Liga had the lowest goals-per-match average of the European leagues, though it was still higher than the PSL. In all of the compared European competitions, both teams scored in more than half of the matches; in South Africa, this figure was 43.8 per cent.
Fewer Goals Leave More Room for Stalemates
According to the worldfootball.net data used in the analysis, the proportion of goalless matches in the PSL is more than twice that in the Premier League (6.1%). South Africa's draw rate of 33.0 per cent was also higher than that of all the European leagues in the table. Therefore, when predicting a match result, a draw must be given serious consideration.
The plausible match results are accounted for by a narrow range of scores. In Dongqiudi's incomplete PSL dataset for the 2023/24 season, the most common result was 0–1, followed by 1–1 and 0–0. Despite all falling below the same threshold for the total number of goals, these results require different predictions regarding the match winner.
Scoring also varies between seasons. The season-by-season results from worldfootball.net below range from 2.26 goals a match in 2018/19 to 2.00 in 2021/22.
Goal Totals and Goals at Both Ends
For 'Over 2.5 goals', at least three goals must be scored in total by the two teams. For 'Under 2.5 goals', no more than two goals can be scored. Sportmonks distinguishes between the total number of goals scored and the condition that both teams must score, whereby each team must score at least once.
The scores illustrate why these markets need to be considered separately.
How scorelines fit different goal markets
Source: The total number of goals is defined by Sportmonks, while Dongqiudi defines 'both teams scoring a goal'.
In Dongqiudi's incomplete dataset for the 2023/24 season, Orlando Pirates scored the most goals per match, while Mamelodi Sundowns conceded the fewest.
-
The odds for the total number of goals may be affected by recent results in terms of goals scored and conceded.
-
The odds for the total number of goals may be affected by player availability.
-
The price can also be influenced by head-to-head records and defensive strength.
Sportmonks identifies those factors in goal-total pricing. Before a sports bet, the PSL figures provide a league baseline alongside the teams’ records and the offered odds. Bookmakers include a margin in their prices, and a frequent outcome can already be reflected in a short price.
The Draw Remains Part of the Call
According to season statistics from worldfootball.net, the proportion of draws was 39.2 per cent in the 2020/21 season and 26.7 per cent in the 2024/25 season. Goalless matches accounted for 12.1% and 10.9% respectively. However, the overall draw rate includes draws in which goals were scored, so trends cannot be determined solely on the basis of goalless results.
Home wins accounted for just 39.8 per cent of the PSL sample, a figure lower than that of any European league included in the comparison. Therefore, the home advantage must be viewed in the context of the high proportion of draws.
The odds indicate the likelihood of winning, with the outcome with the lowest odds being the favourite. However, the expected winner may still fail to win, meaning a draw or a victory for the opposition are both possible outcomes. The league's low goal tally provides context for these outcomes, but does not prejudge the result of any individual match.
The PSL season by season
Source: Analysis of South African Premiership results from WorldFootball.net (2016/17–2025/26).
Reading the Records Across Seasons
The analysis of worldfootball.net results shows that the proportion of matches with more than 2.5 goals in recent PSL seasons was lower than in the 2018/19 season. Draws were less consistent: they declined in the 2024/25 season before rising again in the 2025/26 season. Fans wishing to assess a match can take these historical frequencies into account alongside the clubs’ goal records, whilst bearing in mind the respective season and the sample size.
18+; gambling involves risk. National toll-free counselling: 0800 006 008.